Topic C9 — Hypothesis Testing
Table of contents
Null hypothesis and alternative hypothesis
-
Null hypothesis, $H_0$: presumed default state of nature or status quo. In specifying $H_0$, always contains an equality, i.e. $H_0 =$ or $H_0 \leq$ or $H_0 \geq$.
-
Alternative hypothesis, $H_A$: a contradiction of the default state of nature or status quo. Usually, $H_A$ is the outcome we want to test, the “desired” outcome.
We use sample information to infere unknown population parameters. We do hypothesis testing: we determine whether the evidence from the sample contradicts $H_0$.
Outcomes:
- Reject $H_0$: sample evidence inconsistent with $H_0$
- Do not reject $H_0$: evidence not inconsistent with $H_0$
Importantly, we can never accept $H_0$.
- Two-tails: $H_0: \mu = \mu_0$vs $H_A: \mu \neq \mu_0$. If we use $\neq$, we say that both tails matter in order to assess $H_0$. Interpretation of the test: “Has no impact”.
- One-tail: $H_0: \mu \leq \mu_0$vs $H_A: \mu > \mu_0$. Interpretation of the test: “Does not increase”. Look at the sign of $H_A$ to assess which tail to use.
Porcedure
- Identify the relevant population parameter of interest.
- Determine whether it is a one or a two-tailed test.
- Include some form of the equality sign in $H_0$ and use $H_A$ to establish a claim.
Hypothesis test using CIs
Decision rule
- Reject $H_0$ if the CI does not contain the value of $H_0=\mu_0$
- Do not reject $H_0$ if CI does contain the value of $H_0 = \mu_0$
Hypothesis test using the p-value
Assume $H_0$ is true and see if sample evidence contradicts it.
The p-value is the likelihood of obtaining a sample statistic at least as extreme as the one in the sample, under the assumption that $H_0$ is true.
If the null hypothesis is true, how likely is that I have a sample at least as extreme as the one I have?
- Caluclate the test statistic of your sample.
- Check what is the area associatied with this $z$
- Check if the are is greater (or smaller, depending on the specification of your test) than the area associated with the significance level you choose.
The p-value tells you the probability that this sample result would be generated if $H_0$ was true. Small p-value = small probability the null is true
Hypothesis test using the critical value
Reject the null hypothesis if the z-score is greater than some critical value.
- Standardize the sample mean using the sample formula. This is your test statistic.
- Check if it’s greater (or smaller, depending on the type of test) than the $z_{\alpha/2}$ with significance level $\alpha$.
Test statistics for the poplation mean
Same “brick” of formula that you used to compute CI.
Not in the formula sheet! $ \frac{\bar{x}-\mu_0}{\sigma/\sqrt{n}} $ or $ \frac{\bar{x}-\mu_0}{s/\sqrt{n-1}} $ if $\sigma$ unknown.
Test statistics for the population proportion
Not in the formula sheet! $ \frac{\bar{p}-p_0}{\sqrt{\frac{p_0(1-p_0)}{n}}} $
Type I and Type II errors
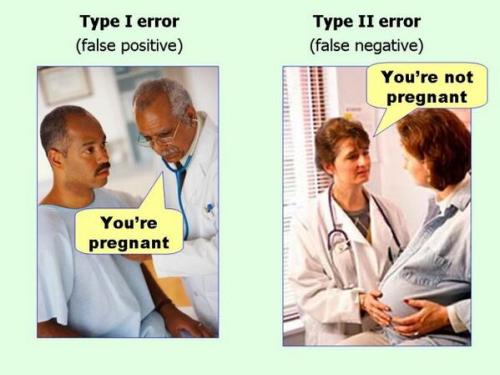
- Type I: $H_0$ is true but we believe in $H_A$ (i.e. we don’t believe in $H_0$).
-
Type II: $H_0$ is not true but we believe in $H_0$ (i.e. we don’t believe in $H_A$).
- Type I: we reject $H_0$ when $H_0$ is true.
-
Type II: we fail to reject $H_0$ when $H_0$ is false.
- Type I: measured by $\alpha$, significance level
- Type II: measured by $\beta$, power of the test.
Both depend of the standard error.
| $H_0$ true | $H_0$ not true | |
|---|---|---|
| Reject $H_0$ | Type I error False positive $\alpha$ | Correct decision Power $1-\beta$ |
| Do not reject $H_0$ | Correct decision Confidence $1-\alpha$ | Type II error False negative $\beta$ |
A decrease in $\alpha$ will increase $\beta$.
If the null hypothesis is “not pregnant”, the following show type I and II error.

